Showcase
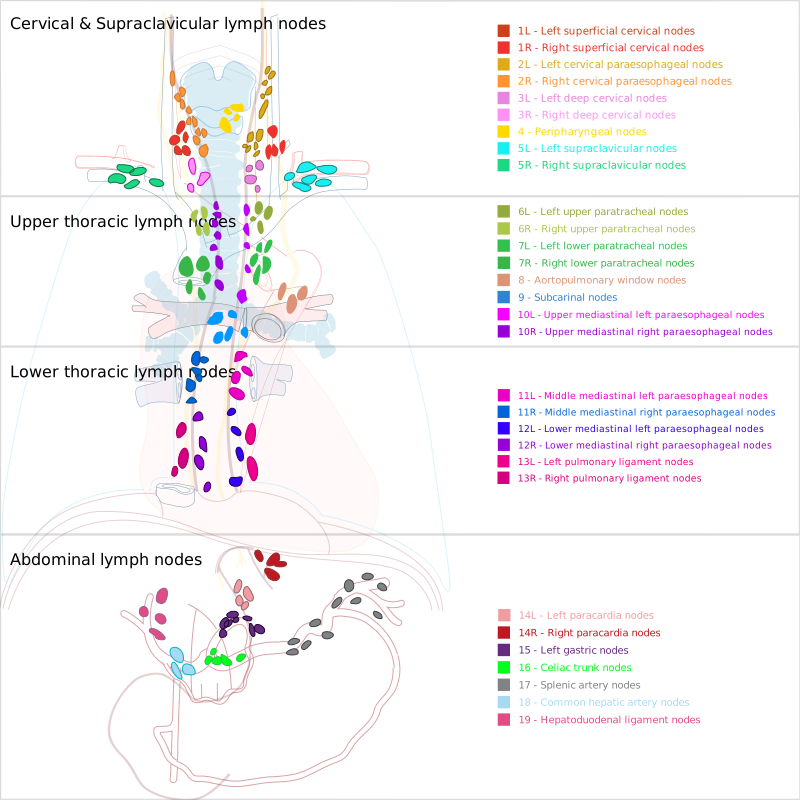
The lymph-node station map
The platform records 41 lymph-node station slots against the TIGER anatomical diagram, and paints three metrics onto it. This page explains what each one measures, what it is measured over, and how to avoid misreading it.
Three metrics, in the order you need them
Use the arrows or your left and right arrow keys to step through them. The same content is written out in full below the slides.
Showing 1 of 3Metastatic rate
Metastatic rate
Of the patients in whom a station was actually removed and examined, the share that had tumour in it.
Metastatic rate
metastatic rate (%) = station-positive patients / patients whose station was examined × 100
Denominator: Patients in whom that station was dissected and pathologically assessed — not the whole cohort.
In plain English
How likely this station is to harbour disease, among the patients where someone looked.
Watch out: A station nobody dissects has no metastatic rate, not a rate of zero. Read it next to the dissection rate below.
All three metrics, in full
The same content as the slides above, without the carousel.
- Metastatic rate
Of the patients in whom a station was actually removed and examined, the share that had tumour in it.
metastatic rate (%) = station-positive patients / patients whose station was examined × 100
Denominator: Patients in whom that station was dissected and pathologically assessed — not the whole cohort.
In plain English: How likely this station is to harbour disease, among the patients where someone looked.
Watch out: A station nobody dissects has no metastatic rate, not a rate of zero. Read it next to the dissection rate below.
- Dissection rate
How often the station was removed at all, across the cohort.
dissection rate (%) = patients whose station was dissected / patients in the cohort × 100
Denominator: Every patient in the cohort, whether or not that station was touched.
In plain English: How consistently the station is being sampled — and therefore how much weight its metastatic rate can carry.
Watch out: A low dissection rate means the metastatic rate above rests on a small and possibly selected subset of patients.
- Efficacy index
The Sasako index: how much survival benefit removing a station could plausibly deliver.
efficacy index = metastatic rate (%) × survival of the station-positive patients (%) / 100
Denominator: Both factors carry their own denominators; the index is null — never a partial product — when either is unavailable.
In plain English: A station scores high only if it is both often involved and its involved patients go on to survive.
Watch out: A high metastatic rate alone does not make a station worth clearing; if nobody positive at that station survives, the index is near zero.
The stations
Numbers below are the published TIGER display numbers, as printed on the diagram.
Cervical & supraclavicular
- 5RRight supraclavicular nodes
- 5LLeft supraclavicular nodes
- 4Peripharyngeal nodes
- 3RRight deep cervical nodes
- 3LLeft deep cervical nodes
- 2RRight cervical paraesophageal nodes
- 2LLeft cervical paraesophageal nodes
- 1RRight superficial cervical nodes
- 1LLeft superficial cervical nodes
Upper thoracic
- 10RUpper mediastinal right paraesophageal nodes
- 10LUpper mediastinal left paraesophageal nodes
- 9Subcarinal nodes
- 8Aortopulmonary window nodes
- 7RRight lower paratracheal nodes
- 7LLeft lower paratracheal nodes
- 6RRight upper paratracheal nodes
- 6LLeft upper paratracheal nodes
Lower thoracic
- 13RRight pulmonary ligament nodes
- 13LLeft pulmonary ligament nodes
- 12RLower mediastinal right paraesophageal nodes
- 12LLower mediastinal left paraesophageal nodes
- 11RMiddle mediastinal right paraesophageal nodes
- 11LMiddle mediastinal left paraesophageal nodes
Abdominal
- 19Hepatoduodenal ligament nodes
- 18Common hepatic artery nodes
- 17Splenic artery nodes
- 16Celiac trunk nodes
- 15Left gastric nodes
- 14LLeft paracardia nodes
- 14RRight paracardia nodes
30 anatomical nodes are drawn on the diagram. The eCRF expands them into 41 station slots: one per side for the bilateral stations, one for each unpaired station, plus a slot per bilateral station for the cases where the operative note documented the station but not the side. Side not recorded is a distinct population from either side — it is not “both” — so those slots are never added to the left and right figures.
Where the station figures are
This page publishes no per-station value. Metastatic, dissection and efficacy figures are computed per station over small populations, so they are served only to authenticated investigators, scoped to the institutions a user may see, and suppressed below a minimum cell size.
The calculation rules — including what is suppressed and why — are documented in the analytics guide, and access is described on the membership page.